
What the Recent Government Shutdown Means for Markets, and for Your Portfolio
10-03-2025
By Steve Gibson
The headlines are loud. Washington is gridlocked. Federal employees are furloughed, and important economic reports are delayed. It’s natural to feel uneasy. But history and the data point to a consistent message: government shutdowns are political events that, while disruptive in specific ways, have rarely caused lasting market damage . Here’s a clear, calm look at what shutdowns are, how long they tend to last, and what investors should really focus on.
Why shutdowns happen
Shutdowns occur when Congress and the White House fail to agree on appropriations or a stopgap continuing resolution to fund federal operations. Often, they are used as bargaining tools to press broader policy goals. Each shutdown has its own political dynamics, but the common thread is this: they’re driven by negotiation breakdowns, not by sudden shifts in the underlying economy.
How long shutdowns usually last
Since the mid-1970s there have been about 20 shutdowns; the average length is roughly eight days. Some end in a day or two, while others drag on for weeks. Duration depends on political incentives, public pressure, and practical consequences—especially when essential programs or benefits start to run out.
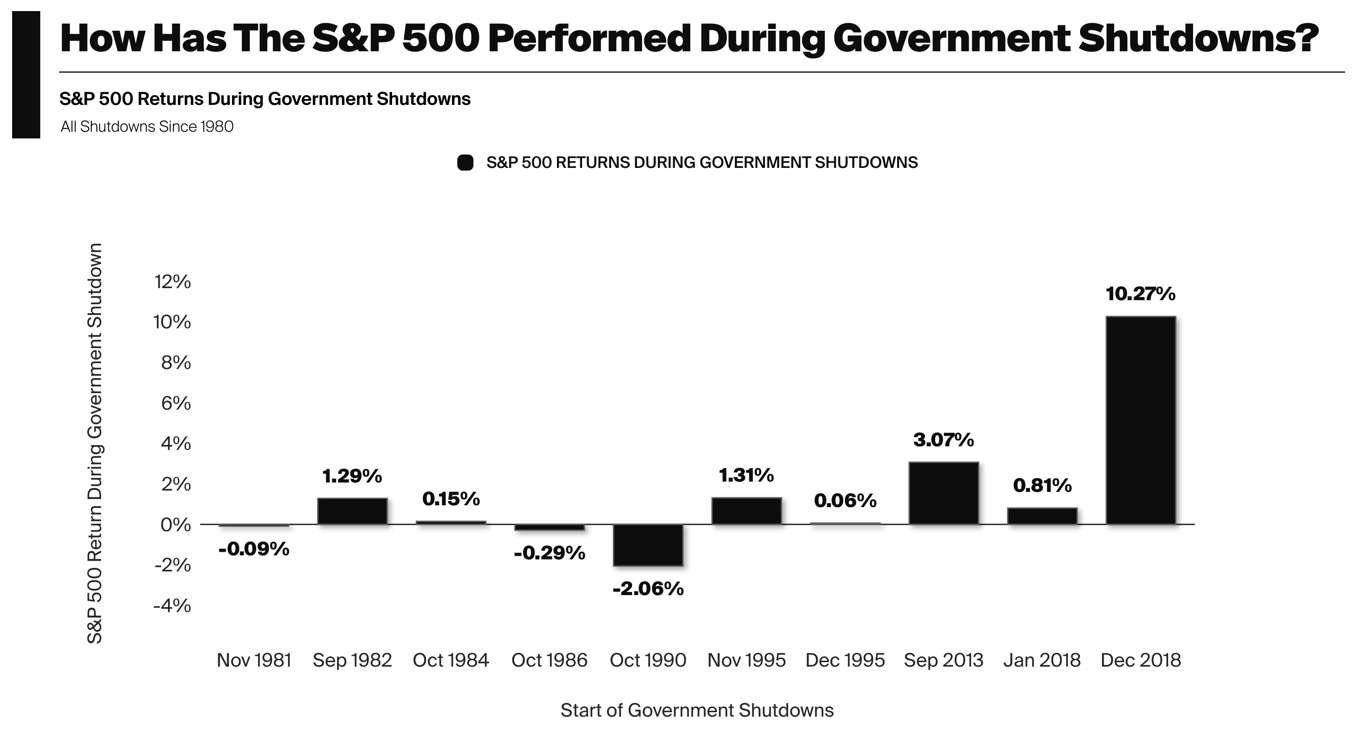
What the market data shows (See chart above)
Markets tend to look past shutdown headlines. Key facts to keep in mind:
- In 7 of the last 10 shutdowns since 1980, the S&P 500 posted a positive return during the shutdown window.
- The last 5 shutdowns since 1995 have all resulted in positive market performance.
- On average, the S&P 500 gained about 1.2% one month after shutdowns ended and about 2.9% over three months.
- Major, market-driving forces, corporate earnings, Federal Reserve policy, and global economic developments, have historically mattered far more than short-term budget standoffs.
Where the real risks lie
Shutdowns are not benign for everyone. Areas to watch:
- Sectors reliant on federal spending (defense contractors, certain healthcare services, federally funded research) can see short-term cash-flow pressure.
- Economic data delays can increase uncertainty and create short-term volatility, making it harder to read the Fed’s path.
- Social consequences, like disruptions to nutrition programs or grant funding, can be severe for affected communities even if markets don’t plunge.
What investors should do now
Panic is rarely a productive investment strategy. Instead, focus on what you can control:
- Keep perspective: Treat a shutdown as added noise, not a change to the long-term economic trend.
- Check liquidity: Ensure you have an appropriate emergency cash buffer to cover short-term needs.
- Review exposures: Confirm your portfolio isn’t unintentionally concentrated in government-dependent sectors unless that fits your long-term plan.
- Stay diversified and disciplined: Sticking to asset allocation within your risk tolerance generally beats impulsive market timing.
- Consider opportunities: Volatility can create attractive entry points; dollar-cost averaging can reduce timing risk.
A positive, practical outlook
History shows that markets usually absorb shutdowns quickly. That doesn’t erase the real human costs or program disruptions, but it does mean investors who focus on fundamentals, earnings trends, interest-rate expectations, and disciplined allocation, tend to fare better.
The key takeaway: a government shutdown is a political chapter, not a new economic regime.
Chart Disclosures:
Source: © Exhibit A, FactSet Research Systems Inc., Standard & Poor’s | Latest: 2019-01-25
This slide is for informational and illustrative purposes only. The data provided is believed to be accurate, but there is no guarantee of its accuracy, completeness, or timeliness. This is not a recommendation or offer of any financial product. Past performance is not indicative of future results, and investors should consider their own objectives and risk tolerance. Indices, if presented, do not include fees, are unmanaged, and not available for direct investment. Definitions & Methodology: The S&P 500 tracks the performance of 500 large-cap U.S. companies, serving as a benchmark for the U.S. stock market. The index is market cap weighted. The chart shows the market S&P 500 price returns from the start to the end of government shutdowns since 1980. The government shutdown start and end dates are as follows: Nov 1981 (11/19/1981–11/23/1981), Sep 1982 (9/29/1982–10/2/1982), Oct 1984 (10/2/1984–10/5/1984), Oct 1986 (10/15/1986–10/18/1986), Oct 1990 (10/4/1990–10/9/1990), Nov 1995 (11/10/1995–11/19/1995), Dec 1995 (12/14/1995–1/6/1996), Sep 2013 (9/27/2013–10/17/2013), Jan 2018 (1/18/2018–1/22/2018), and Dec 2018 (12/20/2018–1/25/2019).