
Understanding the Buffett Indicator: What It Tells Us About the Stock Market Today
07-22-2025
By Steve Gibson
If you've ever wondered whether the stock market is cheap, expensive, or just right, there’s a simple way to get a rough idea, it’s called the Buffett Indicator. Named after legendary investor Warren Buffett, this little number compares the total value of the stock market to the size of the economy. And right now, it’s flashing a very loud signal.
What Is the Buffett Indicator?
The Buffett Indicator is officially called the Market Capitalization-to-GDP Ratio. Let’s break down what that means:
- Total Market Capitalization is the combined value of every publicly traded company’s shares in the U.S. stock market.
- GDP (Gross Domestic Product) is the total value of all goods and services the country produces in a year — basically, the size of the economy.
The Buffett Indicator divides the total market value by the GDP, giving us a percentage that helps us understand if stocks are cheap or expensive compared to the economy.
- If this ratio is low, it means stocks might be undervalued (cheap).
- If it’s high, stocks might be overvalued (expensive).
Where Are We Today? (July 2025)
Right now, the Buffett Indicator stands at a staggering 210.7%. This means that the total value of all U.S. stocks is more than double the size of the country’s economic output. To put numbers to it:
- Total Market Value: About $63.1 trillion
- US GDP: About $29.96 trillion
The ratio is calculated as:
Market Cap ÷ GDP = 210.7%
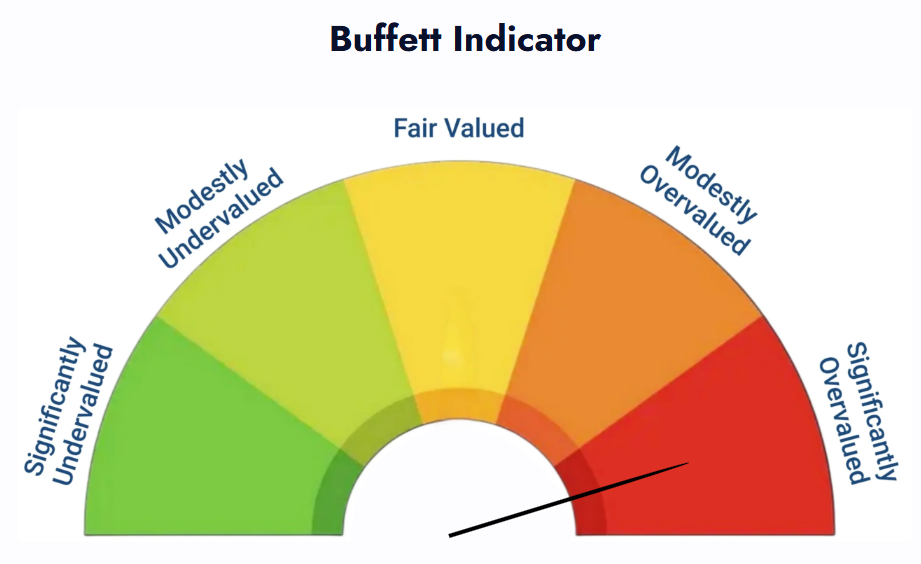
According to the indicator, this is considered significantly overvalued which is the highest level ever recorded in U.S. market history.
How Do We Interpret This Number?
Here’s a simple guide to what different levels of the Buffett Indicator have historically meant:
| Ratio (%) | Market Valuation |
|---|---|
| ≤ 86% | Significantly Undervalued |
| 86% - 111% | Modestly Undervalued |
| 111% - 135% | Fair Valued |
| 135% - 160% | Modestly Overvalued |
| > 160% | Significantly Overvalued |
At 210.7%, the market is well above the “significantly overvalued” threshold.
Why Should You Care?
Warren Buffett himself said, “If the ratio approaches 200%, you are playing with fire.” Historically, when this indicator reaches such high levels, it has often preceded market downturns or corrections. For example:
- In 1999 and 2000, the indicator was near 200%, just before the dot-com bubble burst.
- In late 2021, it neared 200% again, before the market experienced a notable decline.
What About Federal Reserve Assets in the Mix?
Some analysts also factor in the total assets held by the Federal Reserve along with the GDP to get a broader economic picture. Including roughly $6.7 trillion in Fed assets, the adjusted ratio is about 172.4%, still well above the "significantly overvalued" warning level of 131%.
What’s the Bottom Line?
The Buffett Indicator doesn’t predict exactly when a crash will happen, but it does help investors understand if the stock market is entering risky territory. Right now, with valuations at all-time highs, many experts advise caution and encourage investors to review their portfolios carefully.
A Simple Summary
- Buffett Indicator = Total Market Value ÷ GDP
- If the number is high (over 160%), the market is likely overvalued.
- At 210.7% in mid-2025, the market is signaling caution.
- History shows that markets tend to “come back down” to more reasonable levels over time.
- This doesn’t mean you should panic or sell everything, but it’s a good time to think carefully about risk.
Warren Buffett’s Advice
Buffett famously said, “Be fearful when others are greedy and greedy when others are fearful.” This indicator helps you see when others might be “greedy”, buying into an expensive market, so you can make smarter, more informed decisions.
Final Thoughts
The Buffett Indicator is a powerful, easy-to-understand tool that connects the stock market to the bigger picture of the economy. Whether you're an experienced investor or just starting out, it’s a great way to keep perspective on whether stocks are priced fairly, or if caution may be the wise approach.
Remember: No single number tells the whole story. But with the Buffett Indicator at a historic high, it’s a clear reminder to stay informed, think long-term, and manage your risk carefully.